Docker
Monitoring and Logging of Containers in Docker
Monitoring and log recording are fundamental for managing the performance, stability, and security of applications in containers. This chapter explores how to monitor Docker containers and configure logging to gain detailed insights into the operation of the applications.
Basic Monitoring with Docker Stats
 Docker Stats
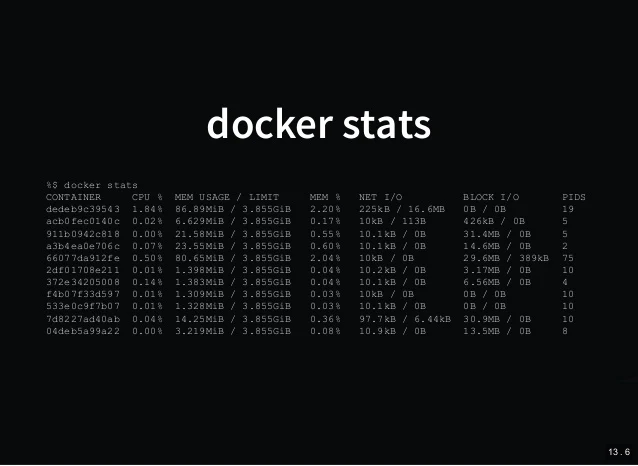
Docker provides the docker stats command to monitor real-time resource usage of containers. This command shows information about CPU, memory, I/O, and network usage for each running container.
bash
Logging in Docker
Docker allows obtaining logs from each container, which facilitates error detection and performance analysis. The docker logs command shows the logs of a specific container.
Viewing Container Logs
To view the logs of a running container, use the following command:
bash
Real-Time Log Tracking
To follow the logs in real-time, use the -f option:
bash
Integration with External Monitoring Tools
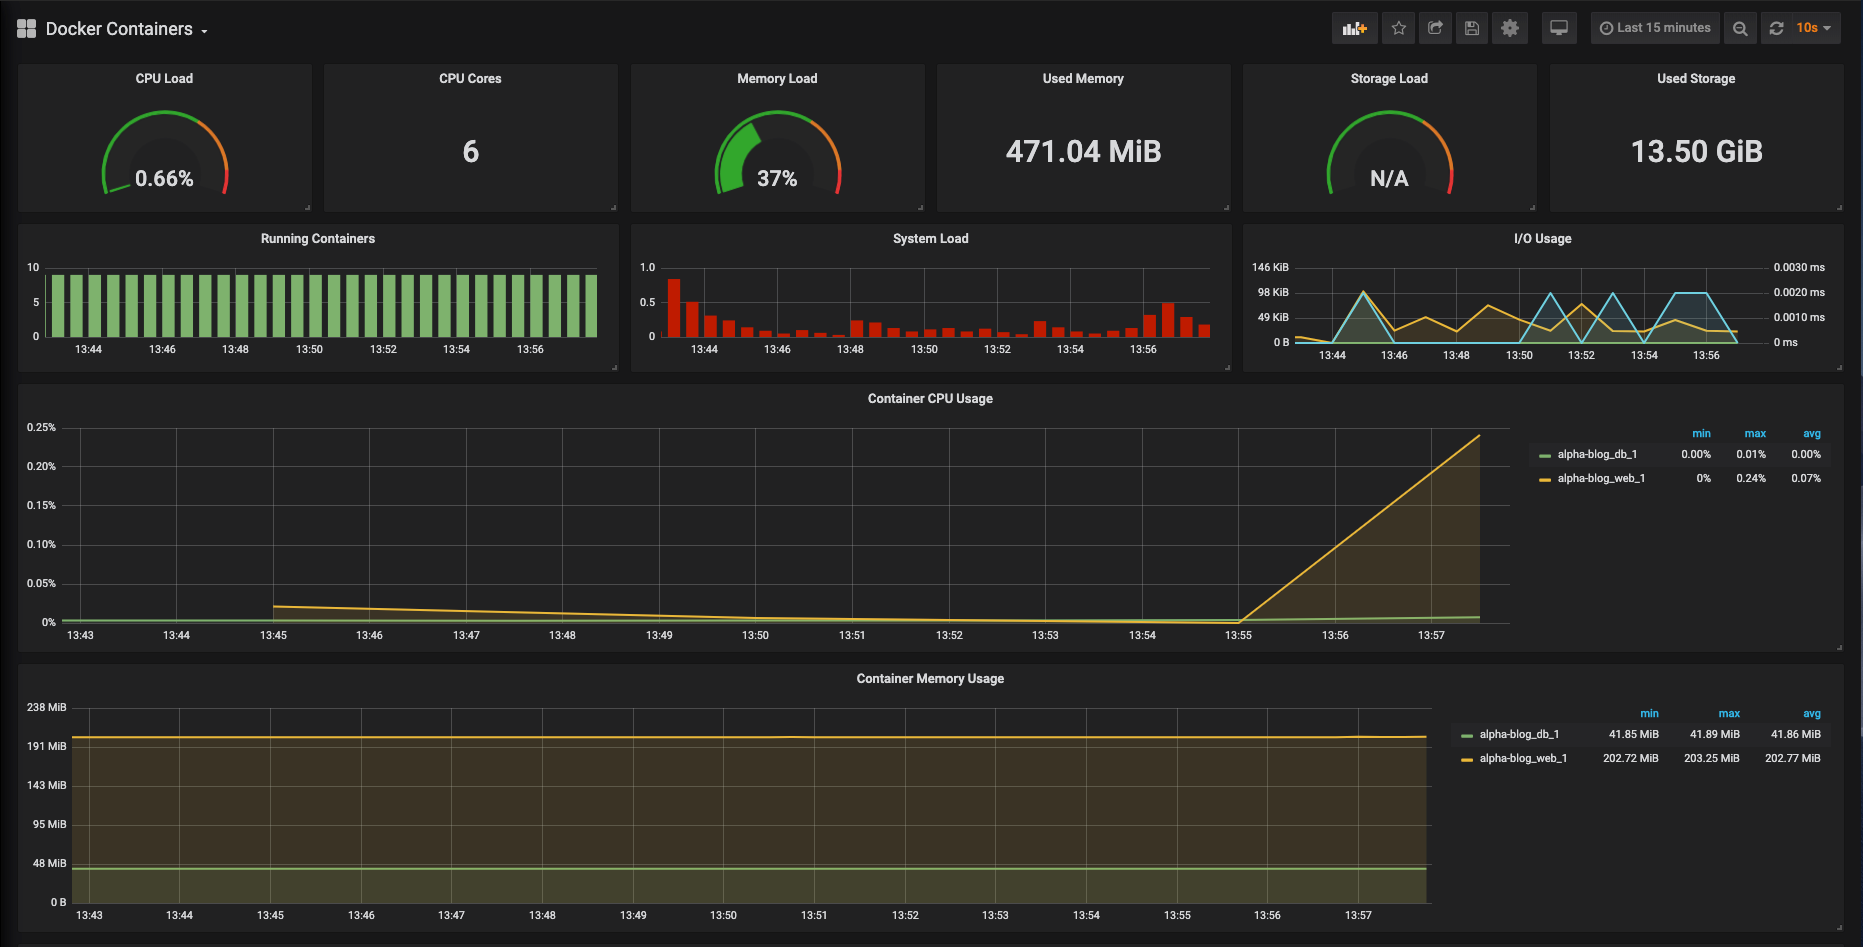
 this image shows a monitoring tool
For advanced monitoring, Docker integrates with monitoring and logging tools such as:
- Prometheus: Monitoring and alerting system that collects metrics and data in real-time.
- Grafana: Metrics visualization platform that integrates well with Prometheus to analyze performance charts.
- ELK Stack (Elasticsearch, Logstash, and Kibana): Allows collecting, analyzing, and visualizing container logs, facilitating diagnostics.
Setting Up Prometheus for Docker
To monitor containers with Prometheus, create a configuration file prometheus.yml that defines the Docker endpoint.
yaml
Then, run Prometheus in a container:
bash
Alert Configuration for Containers
Alerts are essential for quickly reacting to performance issues. With Prometheus, alerts can be configured for events such as high CPU usage or container failures.
Example of CPU usage alert:
yaml
Conclusion
Monitoring and logging in Docker are essential tools for maintaining the performance and stability of applications in containers. With tools like Prometheus, Grafana, and ELK Stack, it is possible to have complete visibility over the state of the containers. In the next chapter, we will explore troubleshooting common issues and debugging techniques in Docker.
Support Chuck’s Academy!
Enjoying this course? I put a lot of effort into making programming education free and accessible. If you found this helpful, consider buying me a coffee to support future lessons. Every contribution helps keep this academy running! ☕🚀

Chat with Chuck

- Introduction to Docker and Containerization
- Installation and Configuration of Docker
- Principles of Containers and Virtualization
- Images in Docker: Creation and Management
- Writing and Optimizing Images
- Volumes and Persistent Storage in Docker
- Networking in Docker: Container Connectivity
- Docker Compose: Multi-Container Application Management
- Best Practices in Docker for Application Deployment
- Resource Management and Optimization in Docker
- Security in Docker and Best Containerization Practices
- Docker Swarm: Basic Container Orchestration
- Kubernetes vs Docker Swarm: Introduction to Kubernetes
- Deployment and Scalability with Kubernetes
- Continuous Integration and Continuous Delivery (CI/CD) with Docker
- Docker Image Registry: Docker Hub and Alternatives
- Monitoring and Logging of Containers in Docker
- Problem Solving and Debugging in Docker
- Migrating Applications to Docker Containers
- Practical Examples: Deploying Web Applications and APIs
- Conclusions and Best Practices in Using Docker


