Intermediate React
React Profiler and Performance Analysis
As our React applications become more complex, it is crucial to analyze and improve performance. In this chapter, we will learn how to use React Profiler to detect performance bottlenecks and optimize component rendering.
What is React Profiler?
React Profiler is a tool that allows measuring the rendering frequency of components and analyzing the time they take to render. This information is useful for identifying components that render unnecessarily or could be optimized to improve performance.
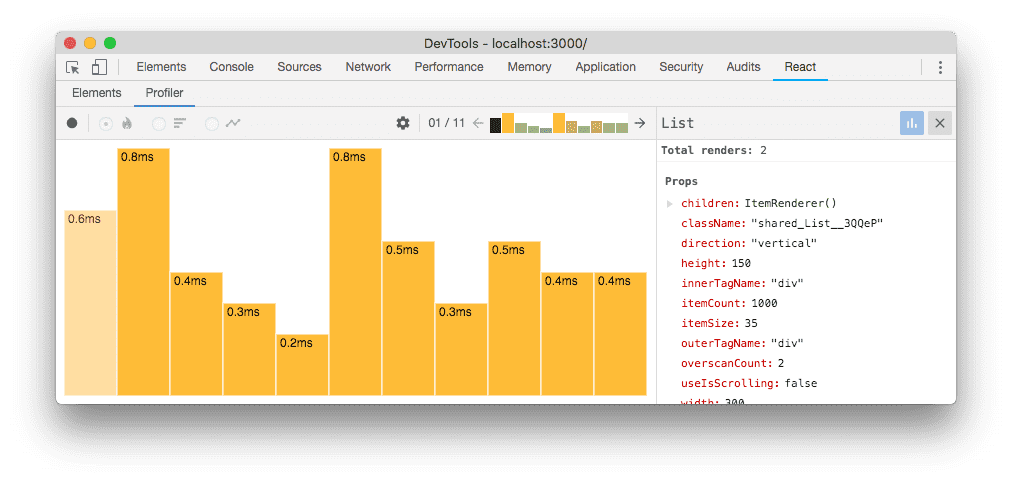
 This image shows the React Profiler interface
Using React Profiler in an Application
To use React Profiler in an application, we wrap the components we want to analyze in the Profiler component. Profiler accepts two main properties: id (a unique identifier) and onRender (a callback function that captures performance information).
Basic Example of Using React Profiler
javascript
Interpreting Data from the Profiler
When capturing rendering times, React Profiler shows us the execution time of each component. This time is measured in two phases:
- Mount: The phase where the component is rendered for the first time.
- Update: The phase where the component is re-rendered due to changes in state or props.
Component Data Analysis
Using the information provided by the Profiler, we can make decisions about which components require optimization. If a component shows high rendering times on each update, we might consider using React.memo, useMemo, or useCallback to improve its efficiency.
Using Additional Performance Analysis Tools
In addition to React Profiler, there are other tools that can help analyze the performance of a React application:
- Chrome DevTools: Allows recording the application's performance and visualizing how different components interact in real-time.
- Lighthouse: An auditing tool that measures application performance, accessibility, and other key metrics.
Example of Analysis with Chrome DevTools
- Open DevTools in Chrome and go to the Performance tab.
- Click on Record and perform actions in the application to record its behavior.
- Review the recording analysis to identify components that take time to render.
Best Practices for Optimization Based on React Profiler
To optimize performance based on Profiler data, consider these best practices:
- Avoid unnecessary renders: Use
React.memofor functional components andshouldComponentUpdatein class components. - Reduce state size: Keep the state as small as possible and avoid creating multiple levels of state in individual components.
- Use Suspense and Lazy Loading: Reduce bundle size by loading components only when needed.
Conclusion
React Profiler and other performance analysis tools are essential for building efficient and scalable React applications. In this chapter, we explored how to use Profiler and Chrome DevTools to identify and solve performance issues. In the next chapter, we will delve into state management in complex applications with advanced techniques.
Support Chuck’s Academy!
Enjoying this course? I put a lot of effort into making programming education free and accessible. If you found this helpful, consider buying me a coffee to support future lessons. Every contribution helps keep this academy running! ☕🚀

Chat with Chuck

- Advanced State Management with Context API and useReducer
- Performance Optimization in React
- Lazy Loading and Code Splitting
- React Profiler and Performance Analysis
- Context API y State Management Escalable
- Render Props and Higher-Order Components (HOC)
- Error Handling in Components with Error Boundaries
- Refs and Direct DOM Manipulation
- React.memo and useMemo for Performance Improvement
- Suspense Implementation for Data Fetching
- Complex Component Communication
- Advanced Conditional Rendering
- Integration with Animation Libraries
- Advanced Custom Hooks Patterns
- Data Handling and RESTful APIs in React
- Data Caching and Persistence Strategies in React
- Accessibility Management in Interactive Components
- Advanced Performance Optimization in React
- Testing Components with Mocking and Integration Tests
- Best Practices in React Component Architecture
- Creation of Reusable React Components
- Conclusions and Next Steps in Advanced React


